Why did my shop's sales drop this month?
The month's coming in short, and you don't know why. Here's how Nolavi works through it, the same way a good mechanic works on a car: find the concern, the cause, the correction, then verify the fix.
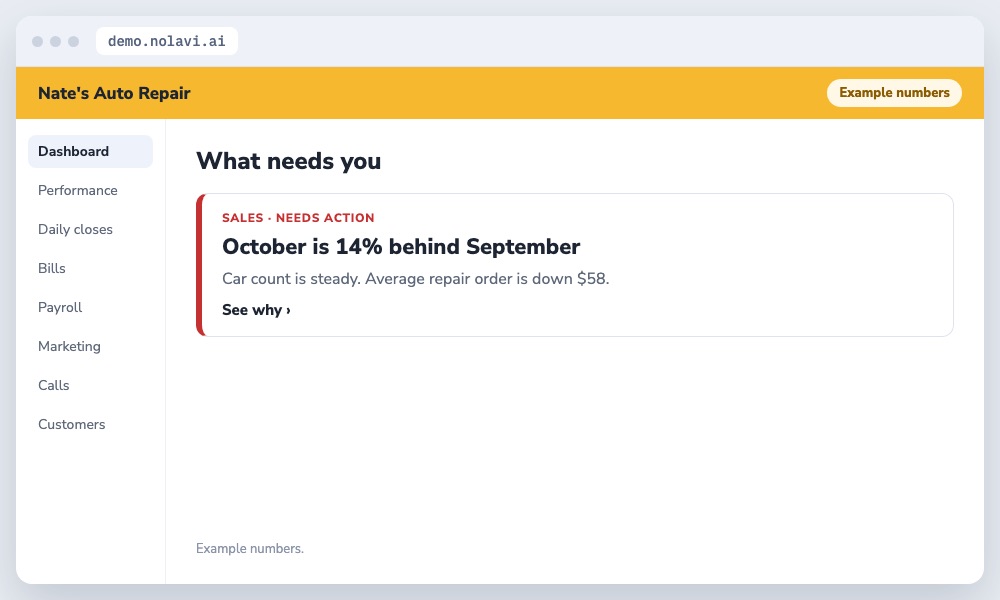
Nate's October sales were tracking 14% below September.

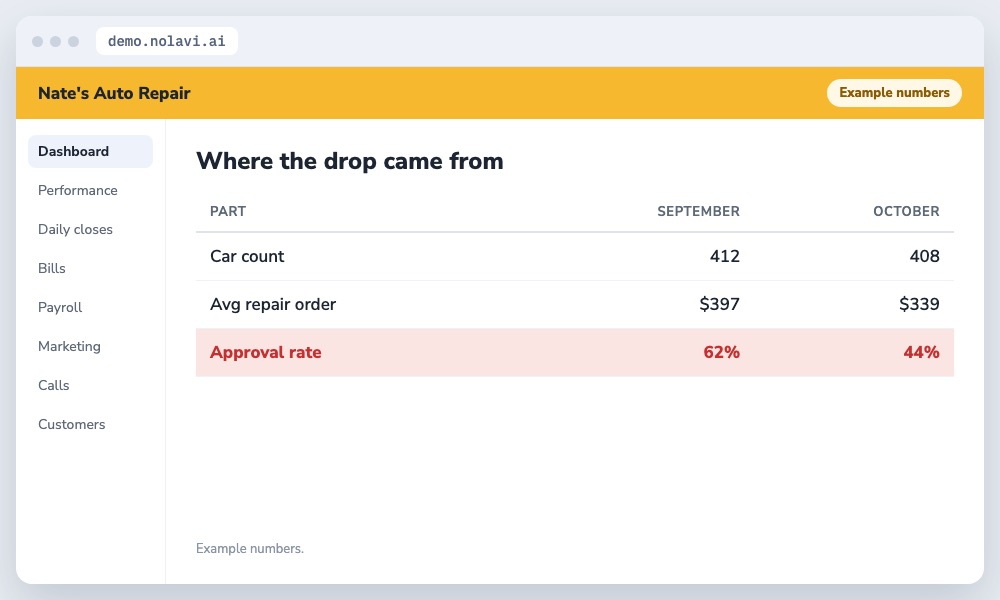
Nolavi split the drop into its parts. Car count was steady. Average repair order fell $58 because the service writer's approval rate on recommended work dropped from 62% to 44%.

The service writer started showing customers photos and the reason for each recommendation, and Nolavi lists declined work for a follow up call.
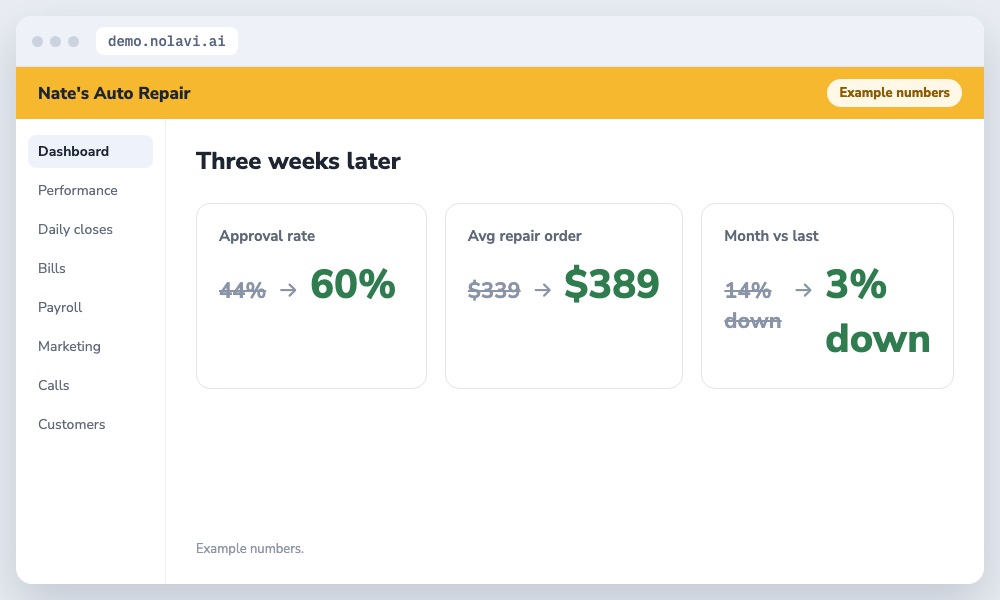
Approval rate recovered to 60% in three weeks and the month closed only 3% below September.

How we work. We make changes like this for shops all the time, using each shop's own data. The numbers shown are examples.
Fewer cars, smaller tickets or fewer approvals. Split the drop into those three to find the real cause.
Show photos, explain why in plain words, and follow up on declined work.
Open the demo and find this kind of problem in a minute. Or book your 14 day free trial: it starts with a quick call, and we set it all up and fit it to your shop.